Our Index is the leading national measure of women's representation across all 50 states at every level of government, providing data and insights on regional, partisan, and state-specific trends. RepresentWomen, our partners, policymakers, and advocates across the country are using the Index to make strategic decisions on policy and structural solutions to close the representation gap.
RepresentWomen Institute · 13th Annual Edition · July 2026
Partners, policymakers, and advocates across the country use the Gender Parity Index (GPI) to make strategic decisions on policy and structural solutions to close the representation gap.
.jpg)
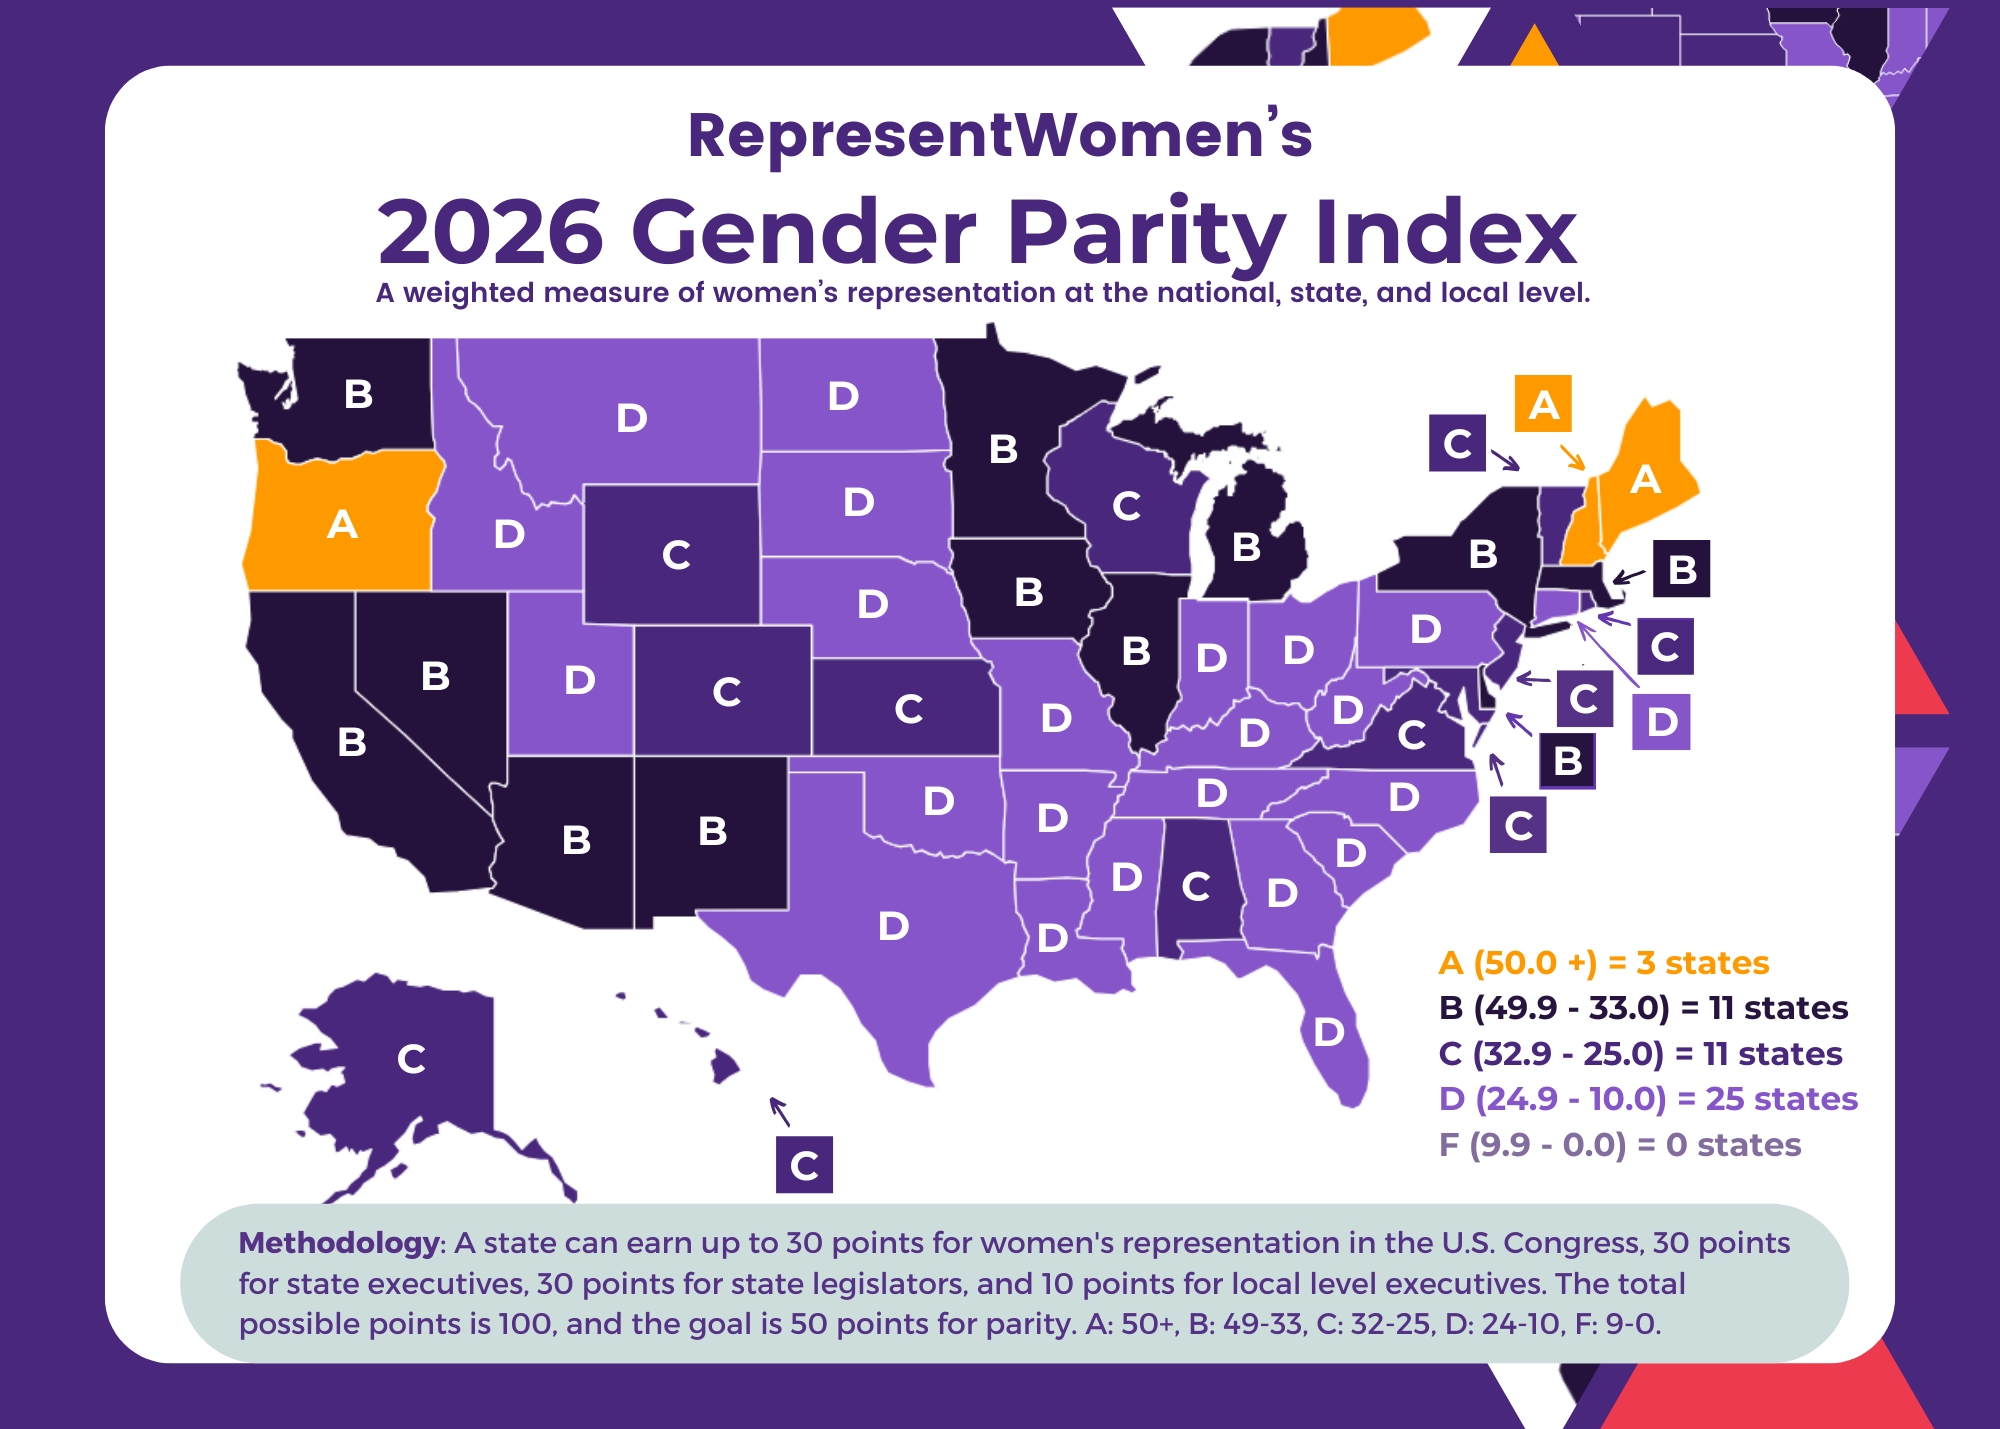
A Shared Baseline for Progress
Measuring women's representation across all 50 states since 2013, our Index is the leading national measure of women's representation across every level of government, providing data and insights on regional, partisan, and state-specific trends to inform strategic decision-making on policy and structural solutions to close the gap.
This Year's Findings
For over a decade, RepresentWomen has tracked women's political representation nationwide, scoring and grading every state on its progress toward gender parity. This year, the U.S. as a whole scored 28.2, a "C" grade, up slightly from 27.7 in 2025, putting the country over halfway to parity. At a glance, that sounds like momentum.
Progress toward gender balance has always been slower and less stable than it appears, but thirteen years of tracking now shows why: the gap between rising candidate numbers, rising campaign funding, and flat parity scores exists because of a structural ceiling built into the election system itself.
"Women are running in record numbers. Campaign funding for women has never been higher. And still, our national parity score has barely moved. That's not a fluke of any one cycle. It's a structural ceiling, and only systems-level reform breaks through it."
— Cynthia Richie Terrell, Founder & Executive Director, RepresentWomen
State by State
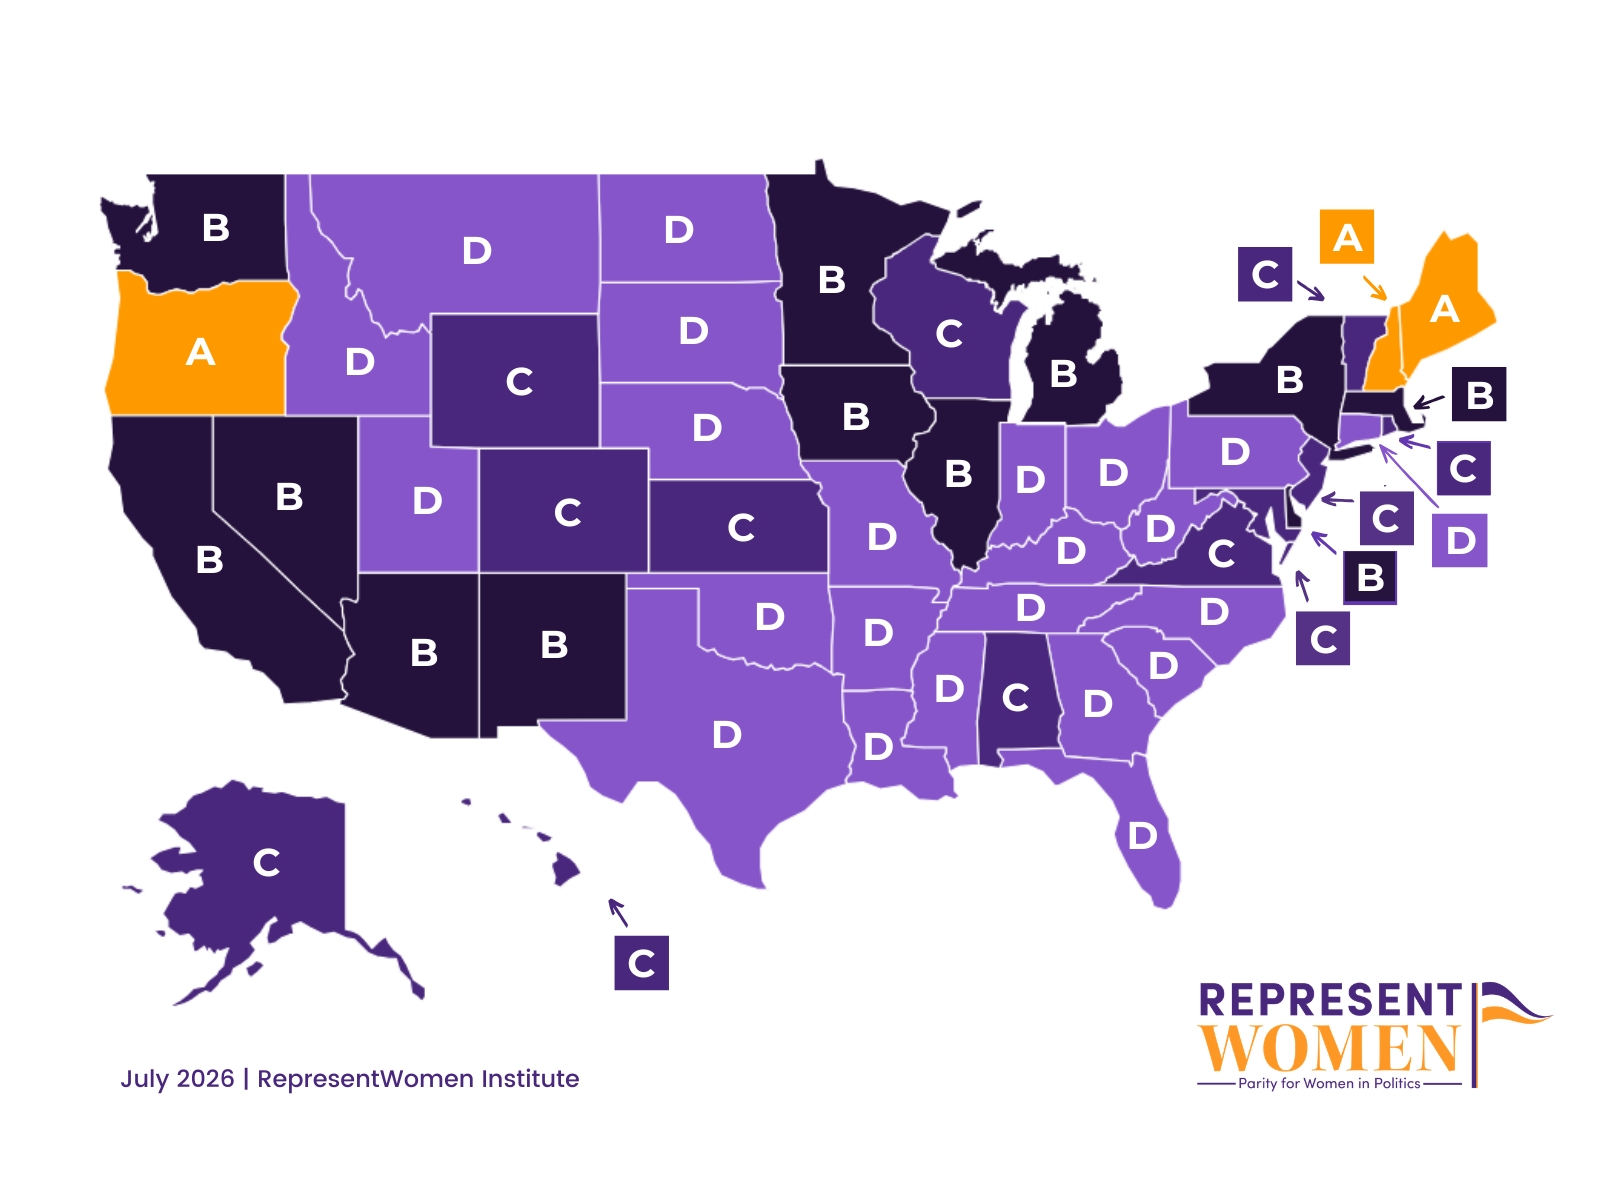
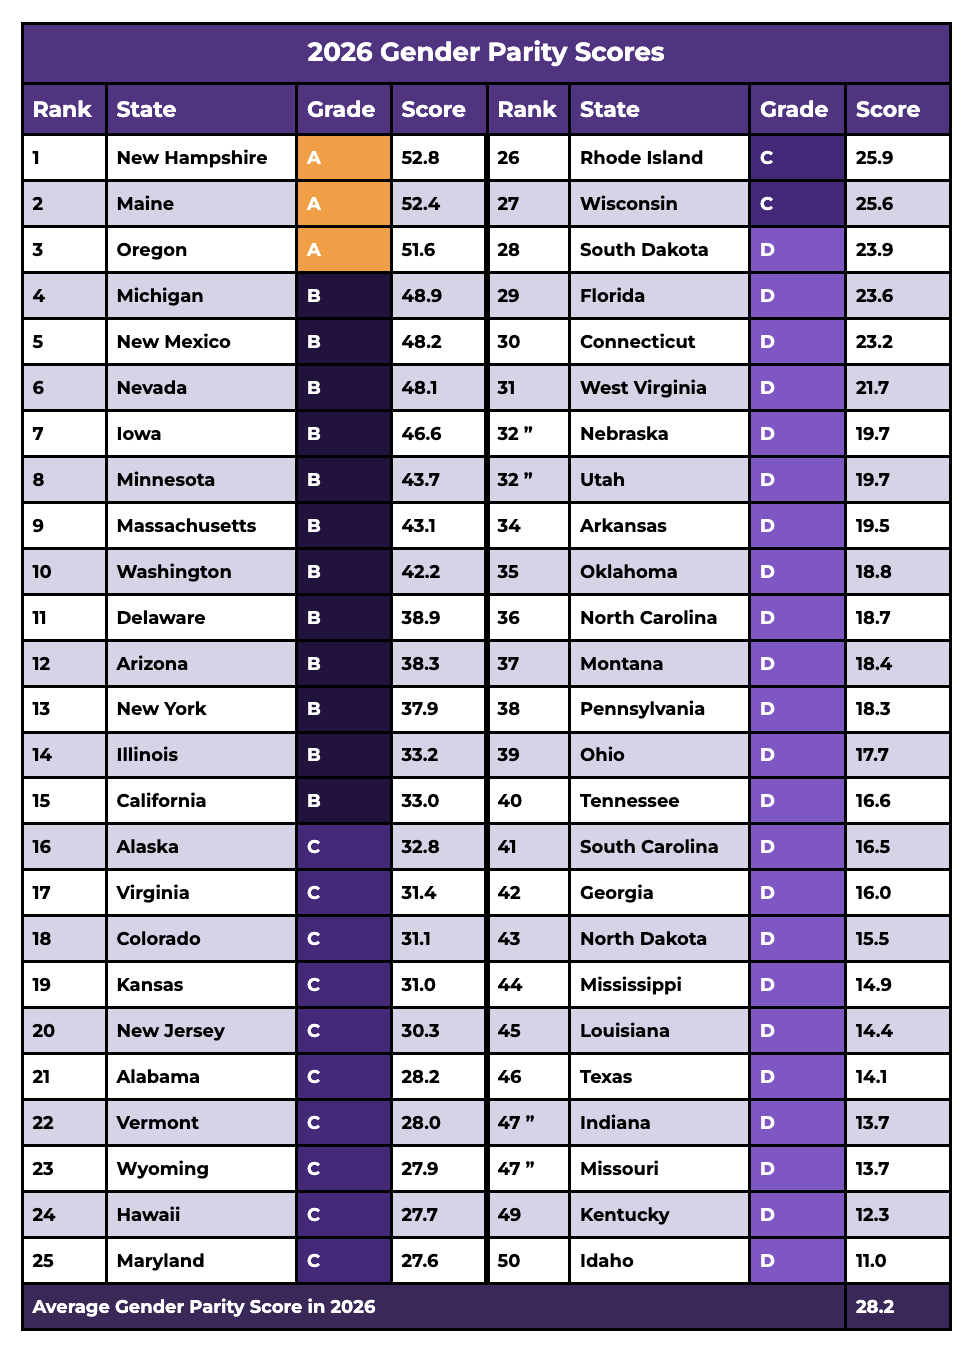
For the second time, three states have received an "A" in the Gender Parity Index. New Hampshire ranks first, with a rounded score of 53/100. Maine ranks second, with a score of 52/100, and Oregon comes in third, with a rounded score of 52/100.
23 states still earn a "D" grade, including Idaho, which ranks dead last out of 50 states. Even states within ten points of parity aren't guaranteed to close the gap: Washington has been "near parity" every year since 2013, proof that proximity alone doesn't translate into progress without structural reform.
Women continue to break records and reach new "firsts," but the country's overall share of political power hasn't significantly improved. Our current system asks women to run, win, and stay in office while operating under a structural ceiling.
Progress Isn't Distributed Evenly
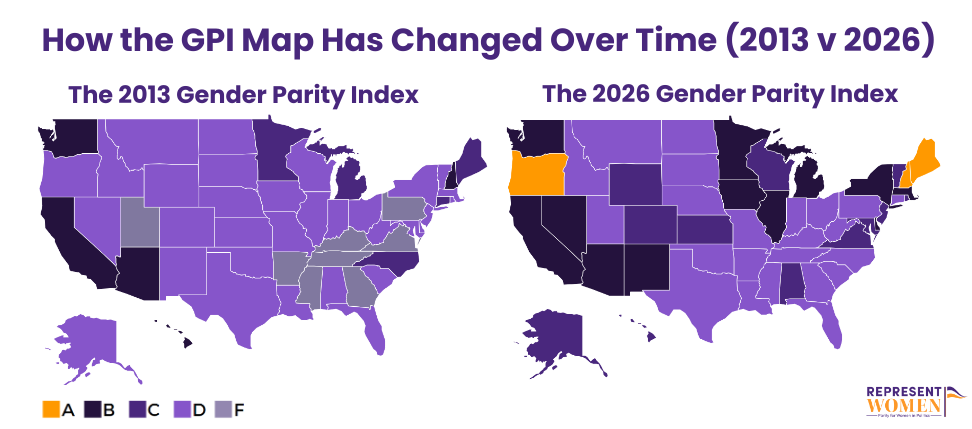
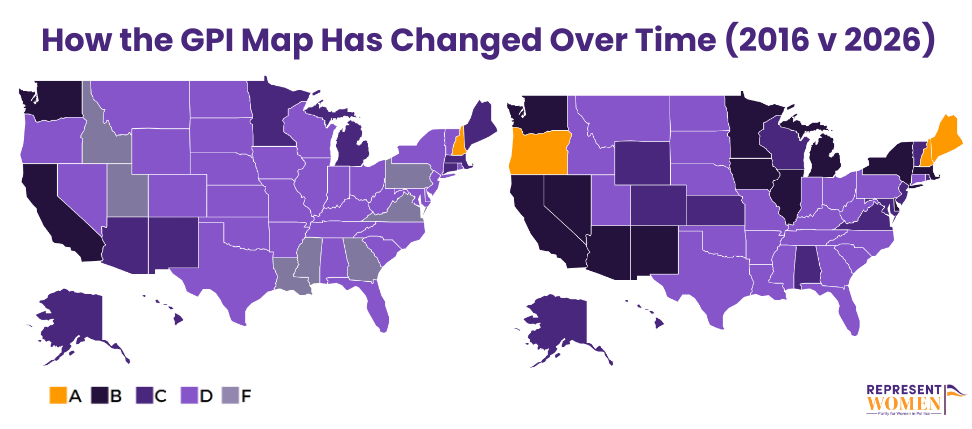
Since 2013, each iteration of RepresentWomen's Gender Parity Index has helped to demonstrate that progress toward gender parity across all levels of government is slow and uneven. Increases in women running for office and winning have not been sustained over the last few years, and progress toward parity has slowed, but not quite stalled, as a result. Systemic change is needed to create better and more sustainable opportunities for women to get elected and build political power.
Scroll to see where progress has been made and where barriers remain. The visualizations below show both.
Full Rankings
Take Action
If your state's score reflects a need for progress, we can help you build the case for it. Our team presents the latest GPI findings to community leaders, elected officials, advocacy organizations, and universities, walking through the methodology and discussing actionable strategies to advance women's representation.
We're also offering exclusive trainings on how to deploy the data, along with custom State Activation Packets built from the GPI findings, available through our Women's Power Collaborative. Join for free to access these bonus sessions and tailored materials.
Women Are Not a Monolith
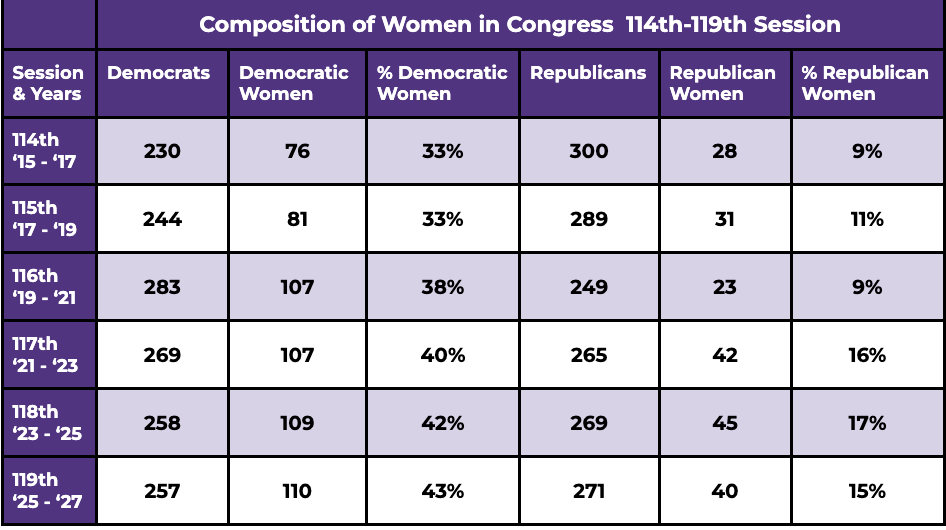
Progress has also been uneven by party. Women are approaching parity within the Democratic Party nationally, while Republican women's representation has not kept pace, despite investment in recruiting them. Closing that gap is essential to reaching parity overall: a system that only produces gains for women in one party will always hit a ceiling, no matter how many candidates run or win on the other side.
"Women are not a monolith. A system that only produces gains for women in one party will always hit a ceiling, no matter how many Democratic women run and win. Every woman deserves a seat at a table designed with her in mind."
— Cynthia Richie Terrell
The Solution
We don't have to look far. Maine and Alaska offer a preview of what changes when the system itself is redesigned. Ranked choice voting replaces plurality elections, where a candidate can win with less than half the vote, with a guarantee of majority support, easing the vote-splitting dynamics that make it hardest for women to break through in the first place.
Proportional RCV goes a step further for offices where it fits: in multi-winner contests, more than one candidate can win representation from the same election, so gains for women stack instead of simply relocating from one seat to another.
Get the Full Picture
The complete 2026 Gender Parity Index includes full state-by-state data, methodology, historical trends back to 2013, and RepresentWomen's complete analysis.